An AI SaaS blamed its Meta ads for a ROAS collapse. The data said otherwise.
A subscription AI video tool saw Meta ROAS fall from 1.88 to 0.60 and cut spend from about €3,000 a day to €100. The team blamed weak creative. My Meta Ads audit of €256,555 of spend (1 March to 30 September 2026) found the creative was fine, most of the drop came from how purchases were counted, and 32% of the last quarter's budget went to countries that barely convert.
 Written by Abhishek Thakral, who ran this audit · Free audit, reply within one business day
- Client
- AI video creation SaaS, subscription, sold worldwide
- Channel
- Meta Ads, optimised to purchases
- Period audited
- 1 March to 30 September 2026
- Spend audited
- €256,555 across 30 campaigns
- My role
- Account audit, diagnosis and recovery plan
What the team believed was wrong
After about two years of profitable growth, the account had scaled to €3,000 to €4,000 a day worldwide. Then results slid, tests stopped working, and spend was cut to around €100 a day. Target cost per acquisition was under €40, against an entry plan of about $35 a month.
Our hooks and creative are weaker than competitors'.
The working theory: the ads stopped stopping the scroll, so new creative would fix it.
ROAS won't stay above 1, so we cut spend.
Budget went from about €3,000 a day to €100, which made every test slower and noisier.
Cost per new subscriber doubled in August.
The number the team felt most strongly about, and the one that needed checking first.
On 26 April we changed what counts as a purchase.
Renewals from existing customers stopped firing the purchase event. Only new subscriptions count now.
Understand the business, fix the ruler, then read the data in order
Five steps. The order matters: measuring before judging stops you from fixing the wrong thing.
Start with the business, not the dashboard
Pricing, plans, credits and who buys. A $32 to $39 entry plan against a sub-€40 CPA target means first-month ROAS near 1 is normal; the profit is in retention.
Lock the attribution window
Every export used the same setting so periods could be compared fairly. I pulled nine files: three periods at campaign level, three at ad level, plus country, age and age by gender.
Build a before and after truth table
Spend, purchases, CPA and ROAS for the period before the tracking change, the transition and the last quarter, then the same thing week by week.
Test the creative theory directly
Hook rate, hold rate and click-through rate per period. If the creative had broken, these would have fallen with ROAS.
Find where the remaining money leaks
Countries, ages and campaigns ranked by return, to separate what needs more data from what can be fixed today.
Name what Meta can't show
List the exact data needed to finish the diagnosis, rather than guessing: billing data, the date of the price change and whether the Conversions API is live.
The real drop started on 22 March, not 26 April
Over three periods, ROAS fell from 1.34 to 0.88 to 0.60 and CPA rose from €38 to €79. But the weekly view shows ROAS at 1.88, 1.86 and 1.73 for the first three weeks of March, then 0.86 the week of 22 March. That lines up with Meta's own reporting change on 17 March, five weeks before the account's tracking change.
| Period (2026) | Spend | Purchases | CPA | ROAS | Spend per day |
|---|---|---|---|---|---|
| 1 Mar to 25 Apr | €108,724 | 2,829 | €38 | 1.34 | €1,941 |
| 26 Apr to 30 Jun | €75,899 | 1,342 | €57 | 0.88 | €1,150 |
| 1 Jul to 30 Sep | €71,932 | 913 | €79 | 0.60 | €782 |
0.88 average
Weekly ROAS from Meta Ads Manager. Purple: above 1.5. Red: below 0.5. Weeks of 26 April to 30 June averaged 0.88. On a phone, swipe the chart to see July to September.
Two thirds of "purchases" were view-through: people who never clicked
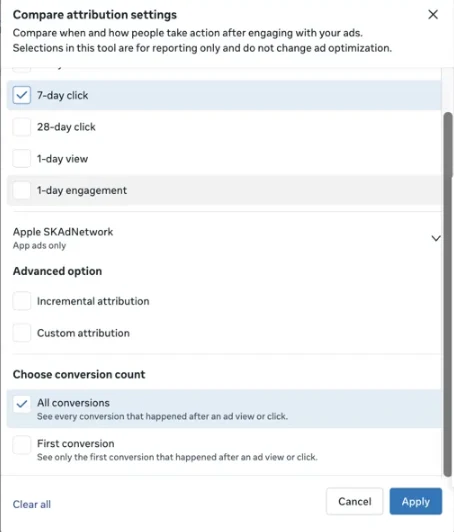
In every period, 63% to 69% of reported purchases were 1-day view: someone saw an ad, didn't click, and bought within a day. Only about a third were click-driven. On a low-price product sold worldwide, that share makes every ROAS number on the dashboard soft.
The creative wasn't the problem
If the ads had stopped working, hook rate and click-through rate would have fallen with ROAS. They didn't. CTR in July to September was 3.12%, up 59% on the "profitable" early period. People were still watching and clicking. The top creative took 34% of last quarter's spend with a healthy 21.4% hook rate; it was the return after the click that didn't hold up.
| Period (2026) | Hook rate | Hold rate | Link CTR |
|---|---|---|---|
| 1 Mar to 25 Apr | 18.4% | 23.4% | 1.96% |
| 26 Apr to 30 Jun | 23.9% | 27.2% | 3.23% |
| 1 Jul to 30 Sep | 15.8% | 22.2% | 3.12% |
A third of the budget was going nowhere
In July to September, €23,083, or 32% of spend, went to countries with fewer than 10 purchases each. Ages 18 to 24 and 65+ took another 16% of spend at a ROAS of 0.33 and 0.37. One worldwide campaign optimised to a different event burned €3,971 at 0.19. And 30 campaigns shared about €780 a day, too little for any of them to learn.
"Cost per new subscriber doubled" was really a 15% rise
The number the team felt most strongly about didn't hold up in the ad data. July: €32,257 spend, 436 new subscribers, €74 each. August: €21,714, 256 subscribers, €85 each. Some single August days spiked near €120, which can feel like double, but the monthly figure rose 15%.
Fix what's certain now, request the data that decides the rest
Do this week
- Cut countries with no purchase signal and the 18 to 24 and 65+ age groups
- Pause the worldwide campaign running at 0.19 ROAS
- Consolidate 30 campaigns into a few with enough budget to learn
- Report on 7-day click alongside the default, so view-through can't hide the trend
Need from the client
- Billing data: real new subscribers and how long they stay
- The exact date of the August price change
- Whether the Conversions API is live, and its match quality
- Confirmation that the optimised Purchase event matches real subscription payments
One more thing worth checking: in the pixel event list, the Purchase event the ads optimise to fired roughly a quarter as often as the subscription payment event. If those measure the same thing, Meta has been learning from a fraction of the real signal, which would explain unstable delivery at €100 a day.
Five checks before you blame your creative
Run these on your own account. They take an afternoon and they stop expensive rebuilds.
Check what your purchase event counts
If renewals fire it, your ROAS is flattered and Meta learns to find people who are already customers.
Read ROAS week by week
Quarterly averages hide when the break happened, and the date usually tells you why.
Look at your view-through share
Split purchases into click and view. The more are view-through, the softer every ROAS number.
Test the creative theory with numbers
Hook rate, hold rate and CTR tell you if the ads stopped working. Check them before ordering new creative.
Judge acquisition cost against lifetime value
A subscription is profitable on retention, not the first payment. Pull how long subscribers stay before you cut spend.
Want this audit on your Meta account?
Send me a few details and I'll tell you whether your problem is creative, measurement or budget leaks.
Meta Ads for subscription SaaS: FAQ
Why did ROAS fall if the creative was fine?
Because most of the fall was in what Meta was counting, not in what customers were doing. Meta changed how it reports conversions on 17 March, and the account stopped counting renewals as purchases on 26 April. Underneath that there was a real but smaller decline: cost per new subscriber kept rising, budget was spread thin across 30 campaigns, and a third of spend sat in countries and ages that barely convert.
Should a subscription business count renewals as purchases in Meta?
Not for optimisation. A renewal is revenue from someone you already acquired, so counting it tells Meta to find people like your existing customers and makes ROAS look better than acquisition really is. Optimise and report on new subscriptions, then judge them against lifetime value from your billing system.
What does a high view-through share mean?
It means Meta is crediting the ads for purchases from people who saw an ad but didn't click it. Here about two thirds of all reported purchases were view-through. Some of those are real, many would have happened anyway, so the more of your conversions are view-through, the softer your reported ROAS is.
What do you need for a Meta Ads audit?
Read access to the ad account is enough to start. To finish properly I also ask for billing data (Stripe or similar) to compare what Meta claims with real new subscribers and their lifetime value, the dates of any price or tracking changes, and whether the Conversions API is live.
Is cost per new subscriber of €85 too high for a €35 a month product?
Not necessarily. It only looks unsustainable if customers cancel after one month. If the average subscriber stays four or five months, €85 is a good price to pay. That is why lifetime value from billing data, not first-month ROAS, decides whether to scale.
Why don't you name the company?
The account belongs to the client, so the name stays private. All figures come from the client's Meta Ads Manager exports for 1 March to 30 September 2026.
Find out if it's really your creative
Send me a few details about your Meta account and what you're seeing. I'll tell you whether the problem is creative, measurement or budget going to the wrong places, whether or not we work together.
Free · Reply within one business day · Month to month, no lock-in